

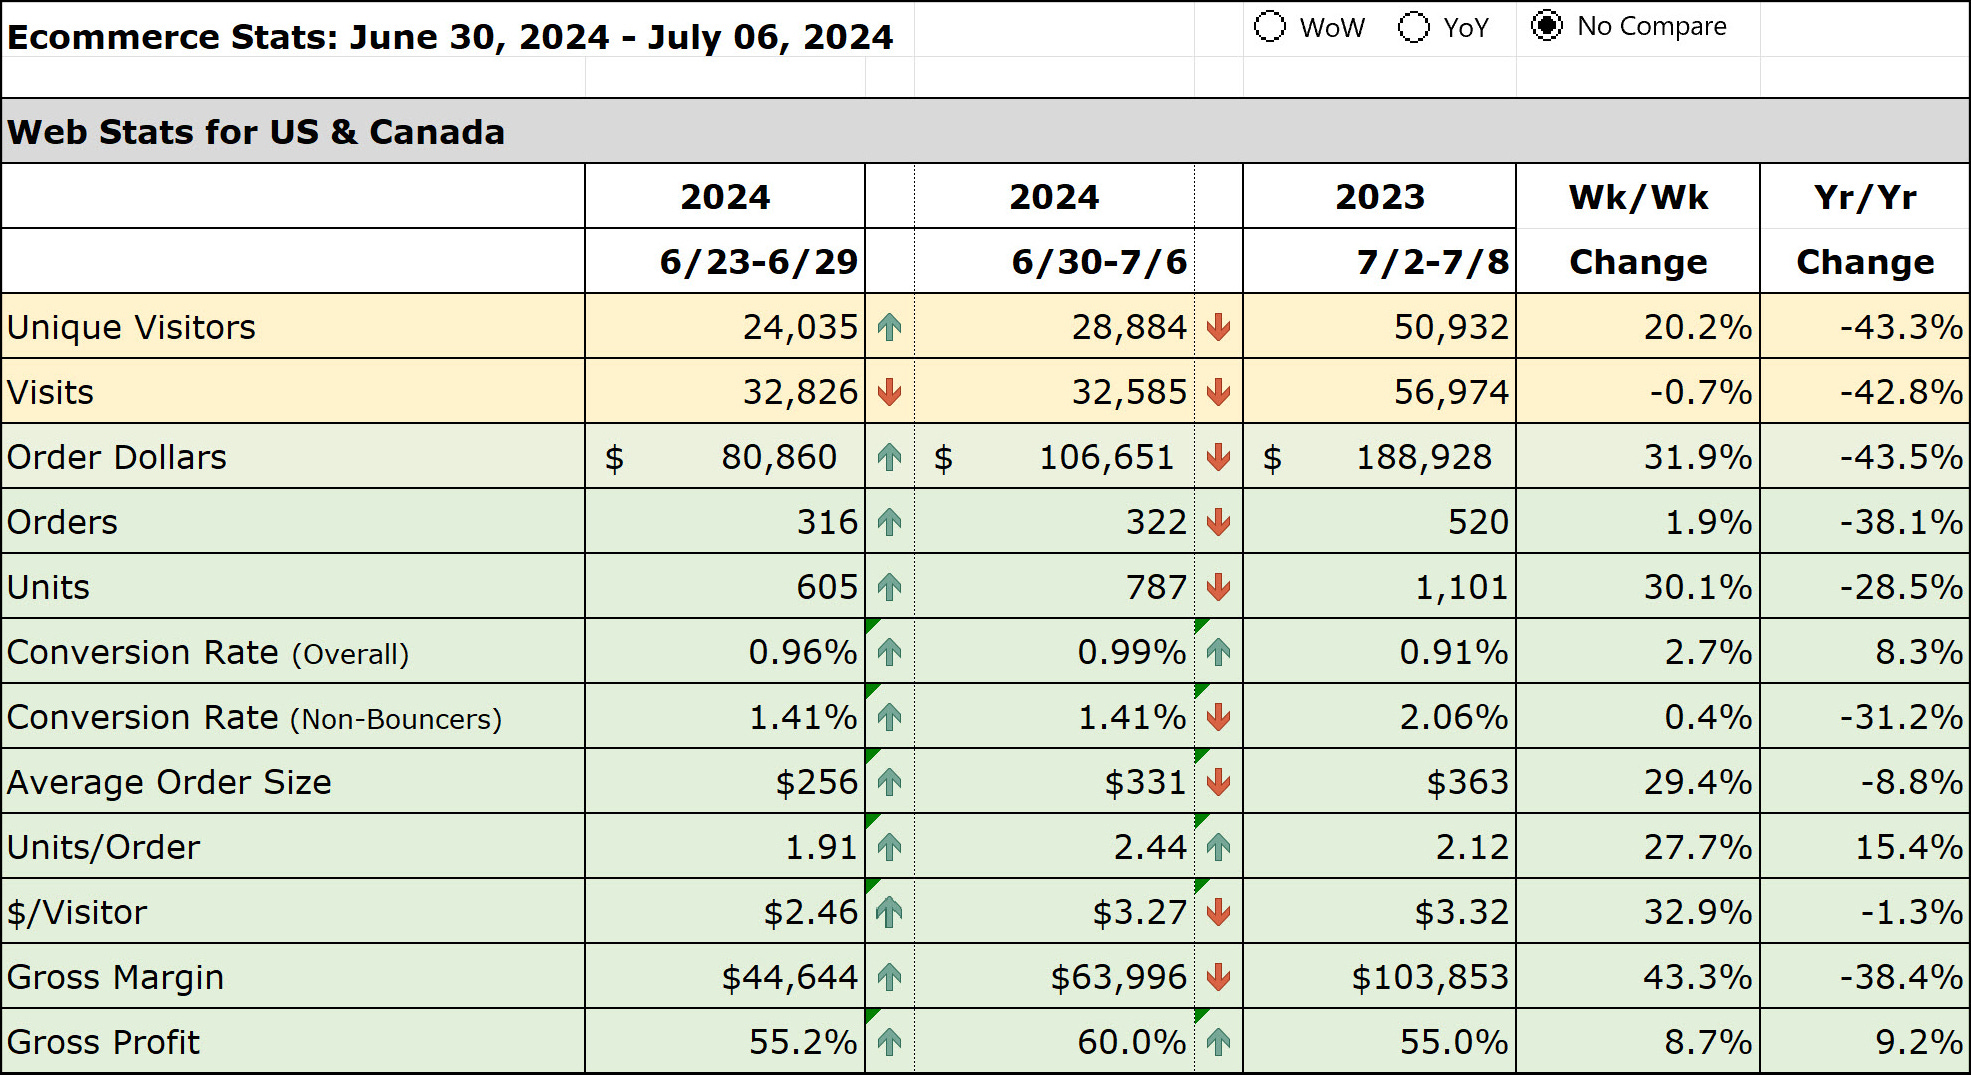
In a growing ecommerce environment, information tends to fragment.
Traffic numbers live in one place.
Orders in another.
Marketplace activity somewhere else.
Promotions, catalog drops, and seasonal factors in yet another file.
By the time leadership tries to understand performance, the week is already over.
This dashboard brought those pieces together into a single operating view.
It allowed the team to track weekly results across the United States, Canada, and multiple European storefronts while maintaining visibility into individual digital channels such as paid search, email, affiliates, direct traffic, and marketplaces.
Beyond reporting totals, the system supported practical management questions:
Where did revenue change this week?
Which channels drove the movement?
Are campaigns influencing results?
Are we seeing device or geography shifts?
How are owned properties performing relative to Amazon?
Because the structure was consistent from week to week, patterns became easier to spot and conversations became faster and more productive.
The goal was not prettier charts.
The goal was shared understanding.
Capabilities Demonstrated
This project reflects my ability to:
design reporting environments that mirror real operating responsibilities
normalize data across regions and channels
build repeatable weekly processes
connect marketing activity to revenue outcomes
reduce the time required to prepare leadership visibility
support both strategic review and day-to-day management
When performance is easier to see, it becomes easier to improve.
Download the dashboard below (60mb, Microsoft Excel required; note: numbers have been fabricated and macros have been disabled in this version):
